
The curtains have now come down on the 2024–25 European football season. It was an exciting campaign that ended long-standing trophy droughts, where four of Europe’s top five leagues crowned new champions. Ever wondered how the winners of these leagues stack up? Here’s a comprehensive breakdown of each champion’s journey: from goals scored and conceded to points earned, overall progress, how long each team led their league and more.
Overview
Europe’s top five football leagues, i.e. English Premier League (EPL), Spain’s La Liga, Italy’s Serie A, Germany’s Bundesliga, and France’s Ligue 1, represent the highest level of club football in their respective countries. Each league operates under a promotion and relegation system, where teams face each other twice (home and away), and the team with the most points at the end of the season is crowned champion. The first three feature 20 teams, whereas Bundesliga and Ligue 1 feature 18 teams. The winners of the 2024-25 season are Liverpool FC, FC Barcelona, SSC Napoli, FC Bayern Munich, and Paris Saint Germain (PSG). The table below shows the final league position of each champion, detailing matches played (MP), points earned (Pts), wins (W), draws (D), losses (L), goals scored (GF), and goals conceded (GA).
| League | Winner | MP | Pts | W | D | L | GF | GA |
| EPL | Liverpool | 38 | 84 | 25 | 9 | 4 | 86 | 41 |
| La Liga | Barcelona | 38 | 88 | 28 | 4 | 6 | 102 | 39 |
| Serie A | Napoli | 38 | 82 | 24 | 10 | 4 | 59 | 27 |
| Bundesliga | Bayern | 34 | 82 | 25 | 7 | 2 | 99 | 32 |
| Ligue 1 | PSG | 34 | 84 | 26 | 6 | 2 | 92 | 35 |
Matchdays as League Leaders
Let’s examine how long each winning team maintained their position at the top of the league table, measured as the percentage of matchdays (MDs) spent in first place in the graph below.
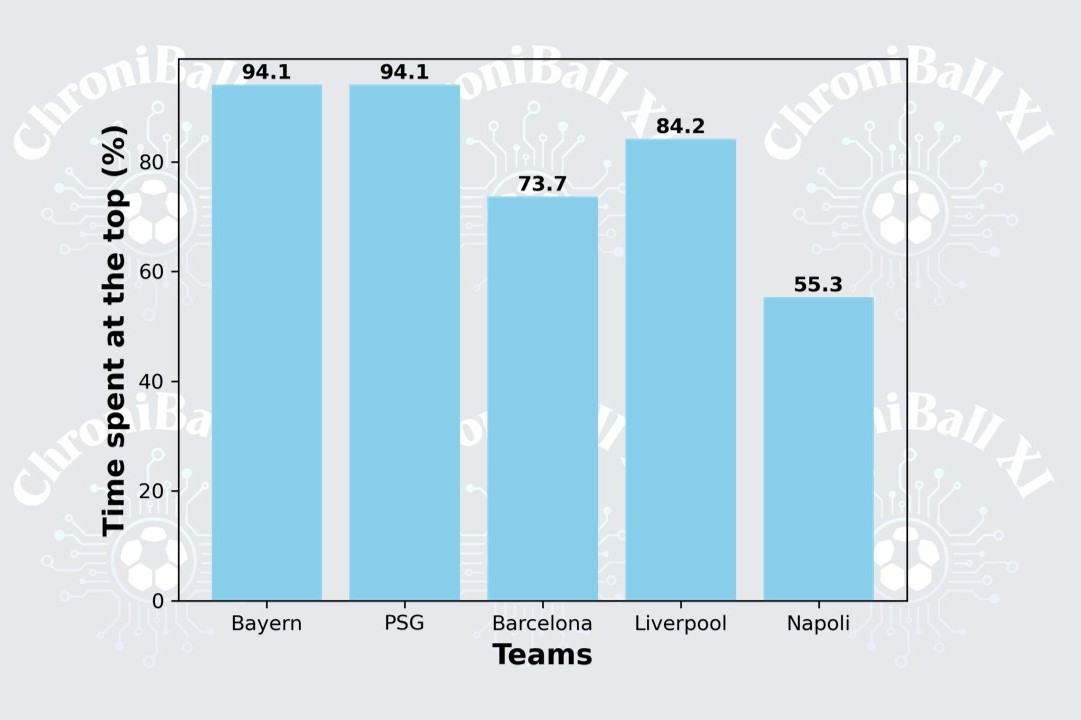
○ Bayern Munich spent 94.1% of the season at the top of the table, holding first place from Matchday 3 until the end. SC Freiburg (Matchday 1) and Heidenheim (Matchday 2) briefly led the standings before Bayern took over. The Bavarians ultimately secured the title with a 13-point lead over second-placed Bayer Leverkusen.
○ PSG showed similar dominance, leading the table for 32 out of 34 matchdays. Olympique de Marseille (Matchday 1) and AS Monaco (Matchday 7) were the only other teams to briefly occupy the top spot. The treble winners clinched the title with a commanding 19-point lead over second-placed Marseille.
○ Barcelona spent 28 out of 38 matchdays (73.7%) at the top. They briefly dropped from first place on Matchday 2 and during the stretch from Matchday 15 to 23. Real Madrid followed with 8 matchdays (21.1%), while Atlético Madrid (Matchday 19) and Celta Vigo (Matchday 2) each led the standings for a single matchday (2.6%). The Blaugrana ultimately secured the title with a 4-point lead over second-placed Real Madrid.
○ Liverpool dominated the Premier League standings throughout the season, occupying the top spot for 32 out of 38 matchdays (84.2%) from Matchday 6. They lost first place once (Matchday 9). Manchester City led for five of those matchdays (MD2 to MD5 and MD9), while Brighton topped the table on the opening matchday. In the end, Liverpool clinched the title with a 10-point lead over second-placed Arsenal.
○ Napoli led the Serie A table for the majority of the 2024/25 season, spending 21 out of 38 matchdays (55.3%) at the top. Inter followed with 9 matchdays (23.7%), while Atalanta led for 5 matchdays (13.2%). Juventus, Udinese, and Torino each briefly topped the table for a single matchday (2.6%). Despite competition in the season, Napoli ultimately established themselves as the most consistent frontrunners and were able to secure the title with a narrow one-point advantage over Inter.
Team Profiles & Consistency in Performance
Although the previous sections provide an overview of their success, they don’t fully reflect how each team fared throughout the season, nor do they provide a fair basis for comparison. In this section, we explore their performances in greater depth to enable a more nuanced and dynamic comparison.
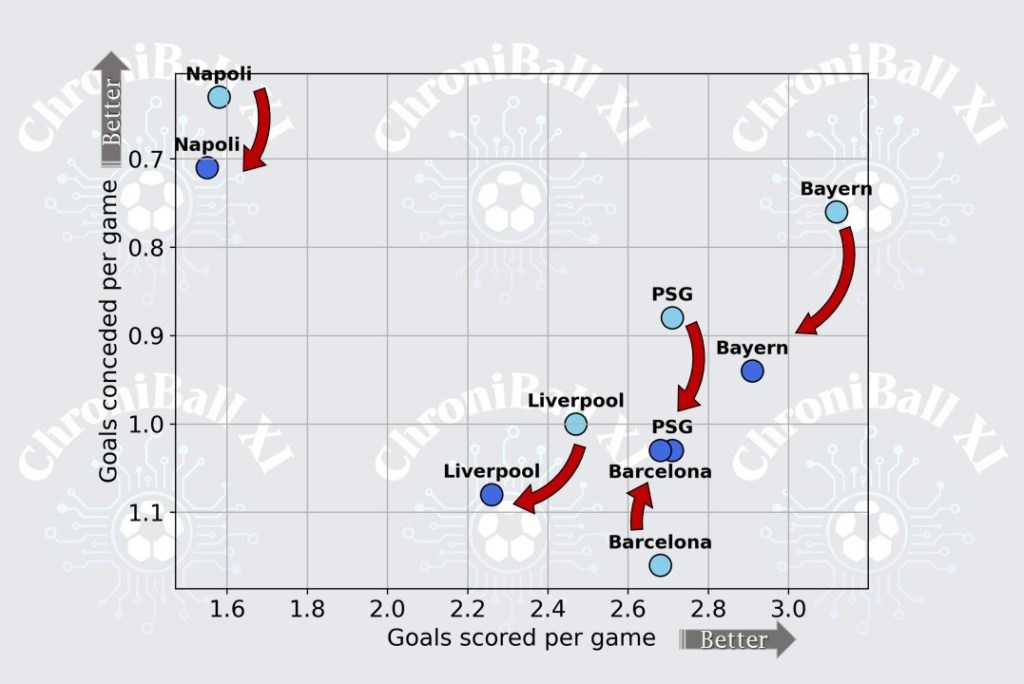
Let’s begin with the most straightforward statistics: goals scored and goals conceded. Since the number of games played varies between leagues, these two metrics are evaluated on a per-game basis to ensure a fair comparison. The graph below illustrates the offensive (horizontal axis) and defensive (vertical axis) profiles of the championship-winning teams. Each circle represents a team’s performance in terms of goals scored and conceded per game. Sky blue circles indicate the team’s status at mid-season (after playing half of their matches), while darker blue circles show their performance at the end of the season. A position further to the right reflects stronger offensive performance (more goals scored per game), while a higher position indicates better defensive performance (fewer goals conceded per game). The red arrows represent each team’s progression over the second half of the season, connecting their mid-season and end-of-season profiles.
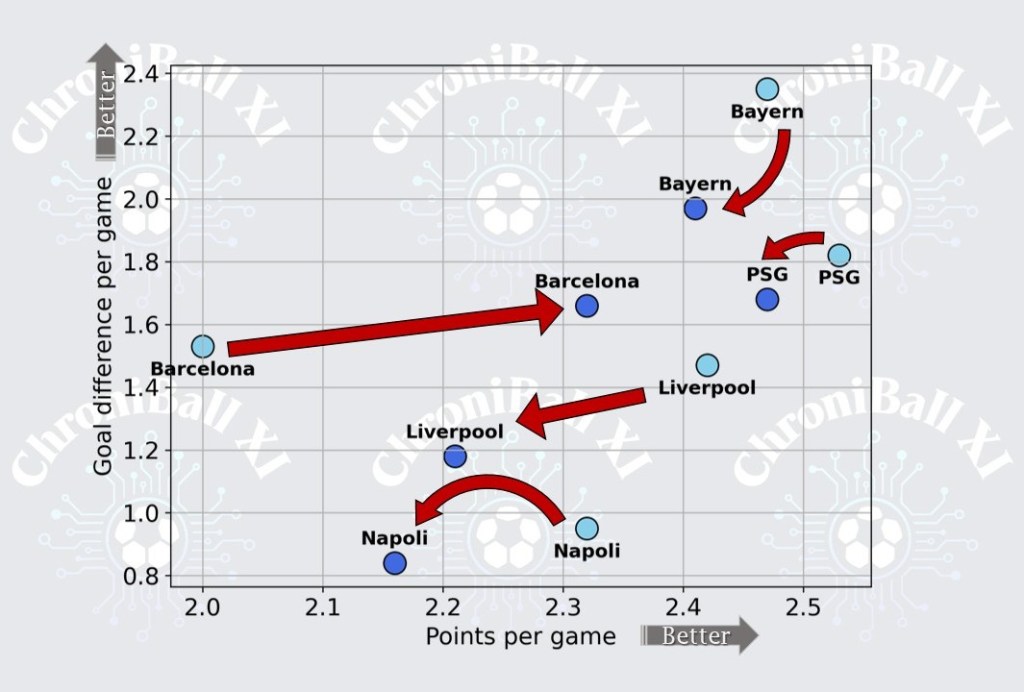
Using the same logic, the graph below presents the performance trajectory of the champions based on points earned per game (horizontal axis) and goal difference per game (vertical axis). Each circle reflects a team’s standing according to these metrics at two key points in the season (sky blue for mid-season values and darker blue for end-of-season performance). Moving rightward on the graph indicates improved efficiency in securing results (more points per game), while upward movement reflects greater consistency and dominance (higher goal difference). Likewise, the red arrows trace each team’s progression from mid-season to the end of the season, offering insight into how their overall effectiveness evolved.
Looking at the graphs, it’s easy to spot how the top teams developed through the season. Bayern were clearly the best going forward. Even with a dip in the second half, they stayed ahead of the rest in terms of attacking output (i.e. goals scored per game).
Defensively, no one came close to Napoli. They averaged just 0.71 goals conceded per game, better than any other league champion, including Bayern, who were second-best at 0.92. Napoli weren’t quite as solid in the second half, but still held the top spot defensively.
Barcelona were the only team to actually improve in all aspects as the season went on, especially at the back. That showed in their results: they won the Supercopa with a statement win over Real Madrid, lifted the Copa del Rey, and nearly reached the Champions League final, missing out after Acerbi’s last-minute equalizer. Their collective growth in the second half paid off and had a tangible impact on their results.
For PSG, the numbers suggest a drop (except in goals scored), but there’s more to it. In fact, they started to ease off in Ligue 1 after building a 10-point lead by Matchday 19. Nonetheless, they peaked in the second half of the season. After coming close to an early exit in the Champions League group stage, PSG bounced back with crucial wins over RB Salzburg, Manchester City, and Stuttgart. Afterwards, they went all the way to the final, where they dismantled Inter 5–0 to complete a historic treble.
On the flip side, Bayern, Liverpool, and Napoli lost momentum.
Bayern’s second half saw them struggle both in the league and in Europe, losing 3–0 to Feyenoord and narrowly edging past Celtic in the playoff round. The only bright spot was their dominant 5–0 aggregate win over Leverkusen, before ultimately being eliminated by eventual finalists Inter.
Liverpool had a strong start and looked like Champions League favorites after topping the table, but the second half was tough. They got knocked out of the FA Cup by Plymouth in the 4th round, lost the EFL Cup final to Newcastle United, and fell to PSG on penalties in the Champions League Round of 16. They still won the league with 84 points, but that’s a far cry from the 97 points they got when finishing second in 2018–19. Klopp probably wasn’t too pleased!
Napoli’s defense held up, but their lack of goals hurt them, averaging just 1 to 2 per game and finishing with a goal difference per game below 1. That saw them lose top spot to Inter and nearly cost them the title after a 0–0 draw with Parma on Matchday 37, which they only saved thanks to Pedro’s stoppage-time penalty against Inter.
Season Progress
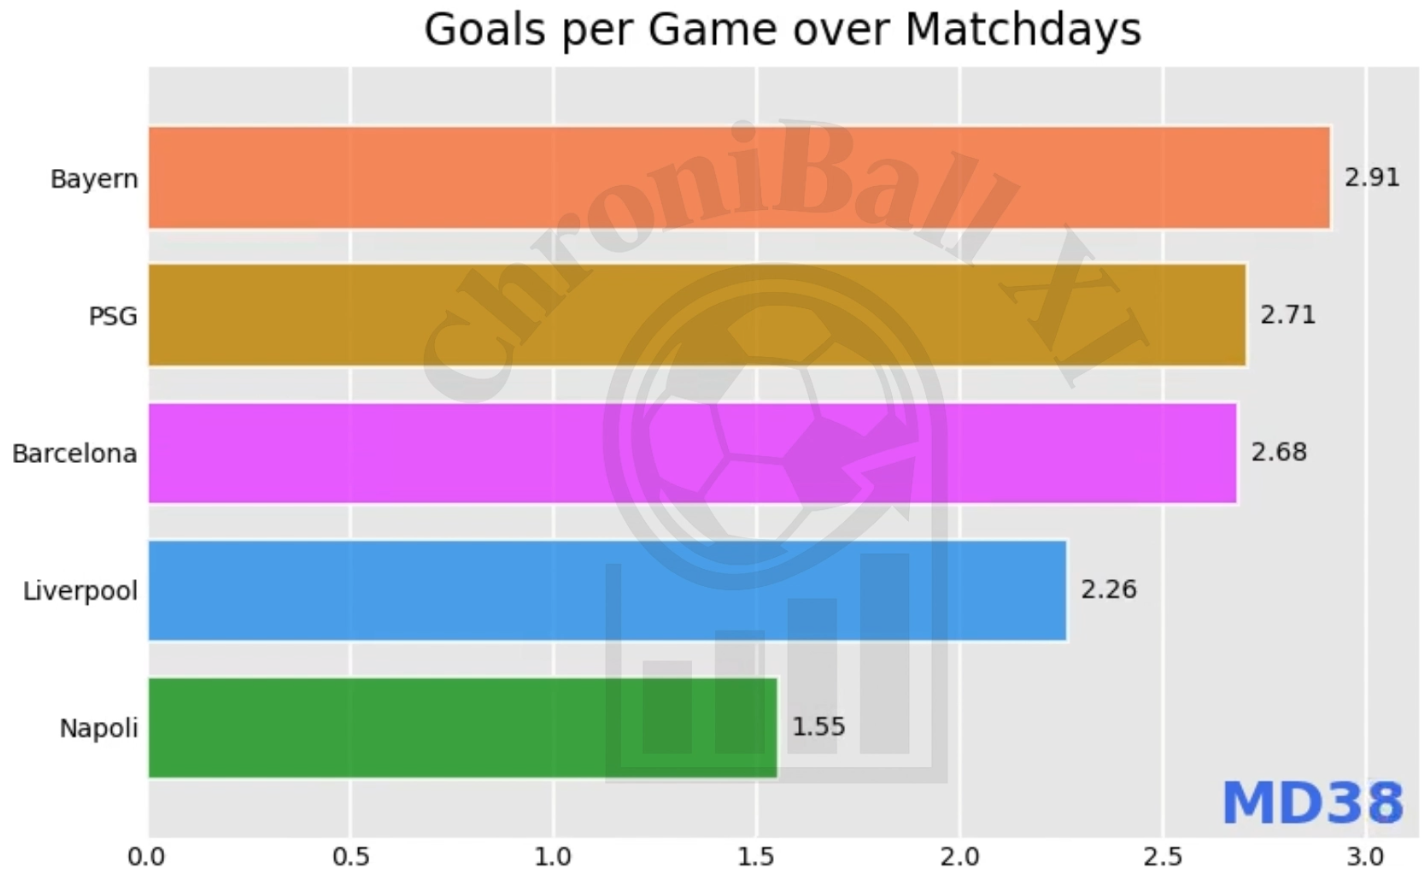
To close the analysis, we look at how key performance indicators, namely goals scored per game and points per game, have evolved for each champion throughout the season.
Goals per Game: Tracks attacking performance, reflecting how consistently a team found the back of the net over the season.
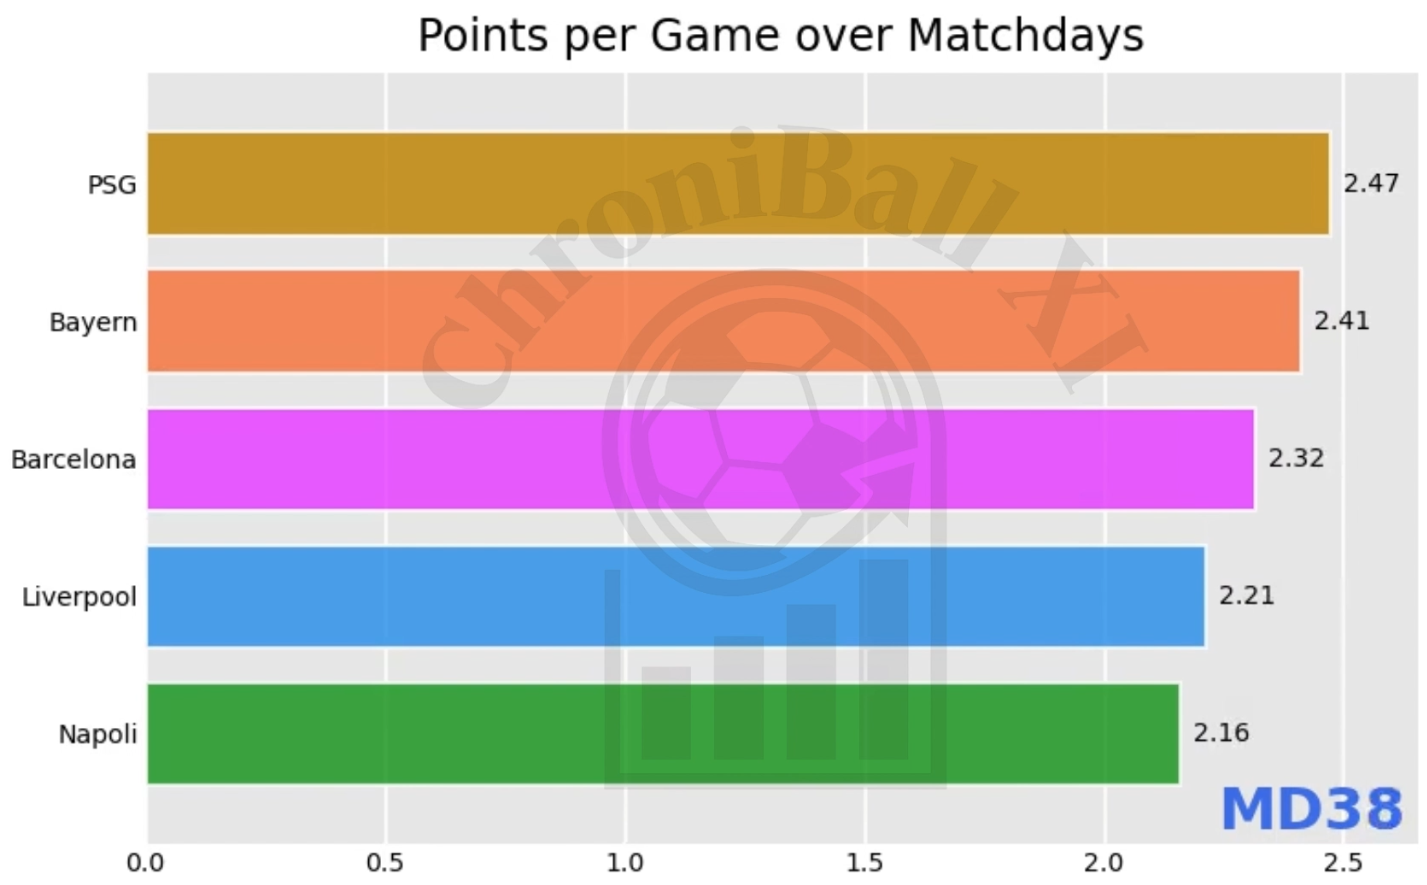
Points per Game: Represents overall efficiency in securing results and is often the best all-around indicator of title-winning form.
The animated bar charts above (click on the metric to watch the corresponding animated chart on our Instagram) show how each team’s momentum shifted from matchday to matchday, highlighting streaks, slumps, and late-season surges that shaped their title runs. Below are the teams’ final positions for each metric, shown in the last frame of the animated charts, illustrating how they ended the season.
Now that you’ve gone through the article, who do you think had the strongest campaign in their domestic league and proved to be the most convincing winner?
ChroniBall XI
Where football meets data, stories, and everything in between
Enjoyed this piece? Follow us on X and Tiktok for more insights, visuals, and updates.

Leave a comment